Logging User Interfaces
I have been building a console for my side project rendering engine that captures log messages and displays them in a nice list that you can view in-engine without going out to the TTY.
I've implemented this on top of fmtlib, and instead call ren::println() or ren::errln() and it appends the formatted line to a list somewhere which is then rendered using ImGui.
This ends up looking like a pretty standard terminal-style line formatted log with a simple filtering and search system (Ignore the validation errors...):
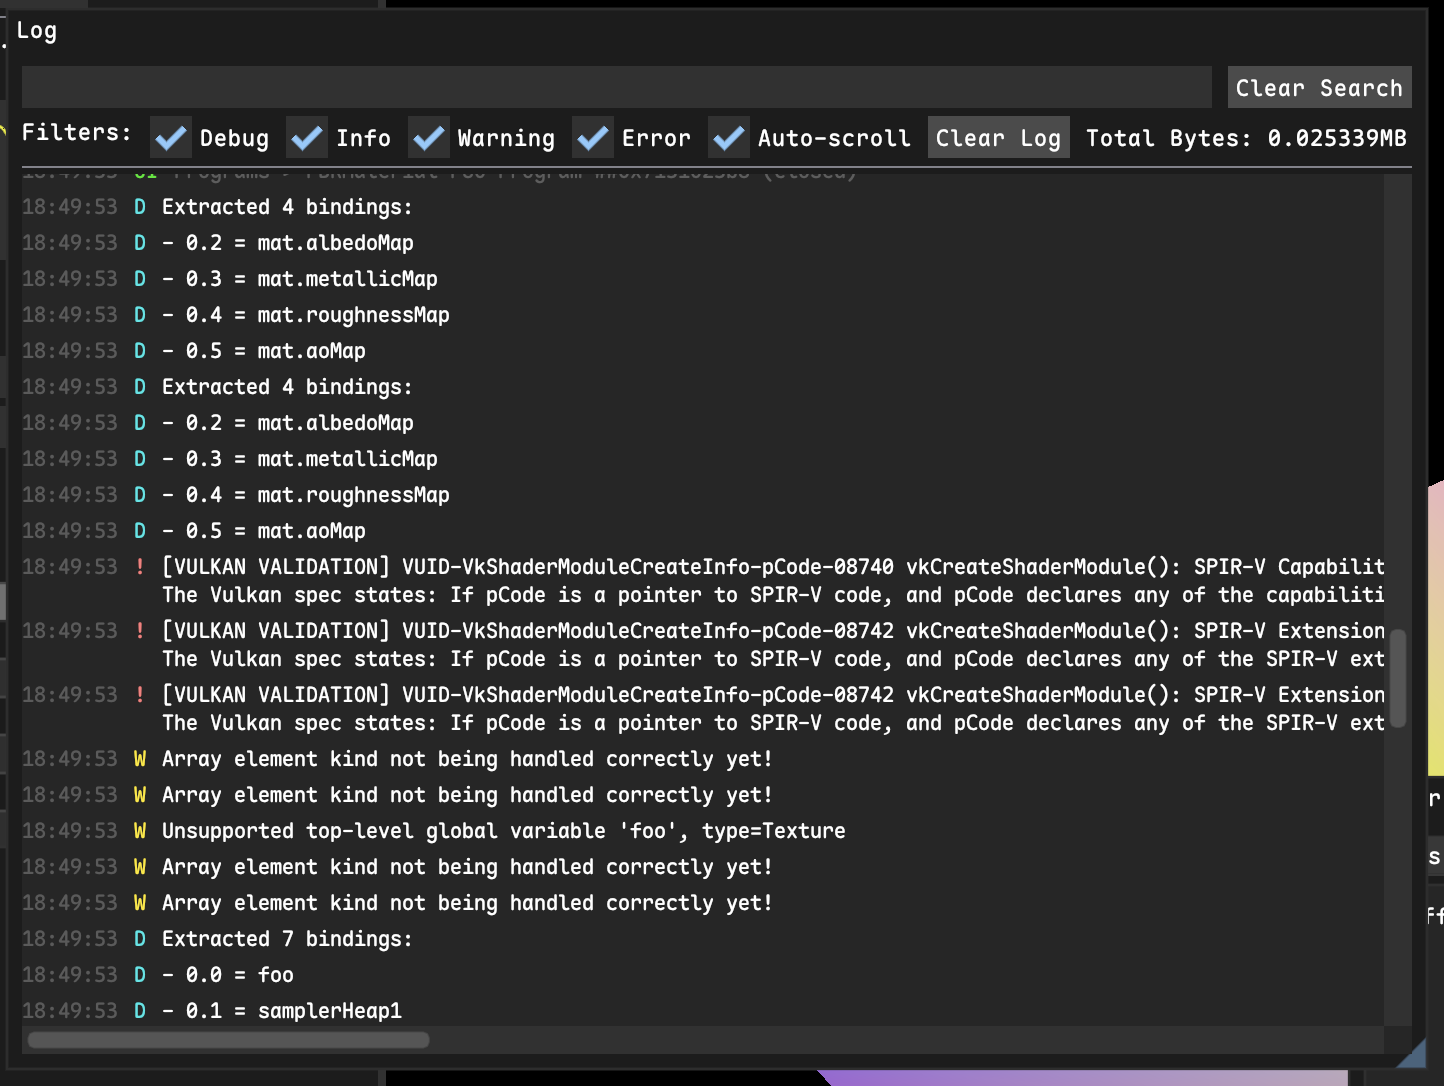
This post is about displaying (potentially one-off) debug logs for a given piece of data. Let's say you want to log the state of a shader program (compiled pipeline of various shader stages that run on the GPU together) to the console to have a persistent view of it for debugging.
ref<ShaderProgram> program = ...;

ren::println("Shader Dumping:");
for (auto &stage : program->stages) {
    ren::println(" stage {} ...", stage.name(), ...);
    // ... and so on.
}
Printing debug state to a console works, but it is terrible at showing how things change over time, especially in a game engine, and it is really annoying to format printf'd text in consistent and easily grokable tables.
User Interfaces for Debugging
One of the biggest things I've enjoyed about this project is that I have access to a framebuffer. I can render images, tables, collapsing lists, or have buttons as a form of debugging; a tool I'd have never reached for before, as most of my work is done on some Linux machine over SSH (and xquartz forwarding is the worst).
It's been great to visualize some part of the system in a little window of the application.
Displaying the complicated state of a shader program like above can be boiled down to a few ImGui::* calls:
ImGui::Begin("A Shader Program");
ImGui::Text("Shader Modules:");
static ImGuiTableFlags flags = ...
if (ImGui::BeginTable("##ShaderProgramModules", 5, flags)) {
    auto colFlags = ...
    ImGui::TableSetupColumn("Name", colFlags);
    ImGui::TableSetupColumn("Type", colFlags);
    ImGui::TableSetupColumn("SPIR-V Size", colFlags);
    ImGui::TableSetupColumn("Handle", colFlags);
    ImGui::TableSetupColumn("##", colFlags);
    ImGui::TableHeadersRow();
    // ...

    for (auto& module : stages) {
    ImGui::TableNextRow();
    ImGui::TableNextColumn();
    ImGui::Text("%s", module->getFilename().c_str());
    ImGui::TableNextColumn();
    ImGui::Text("%d", module->getStage());
    // ...
}
ImGui::EndTable();
// ...
Which shows up as a "window" in my application:
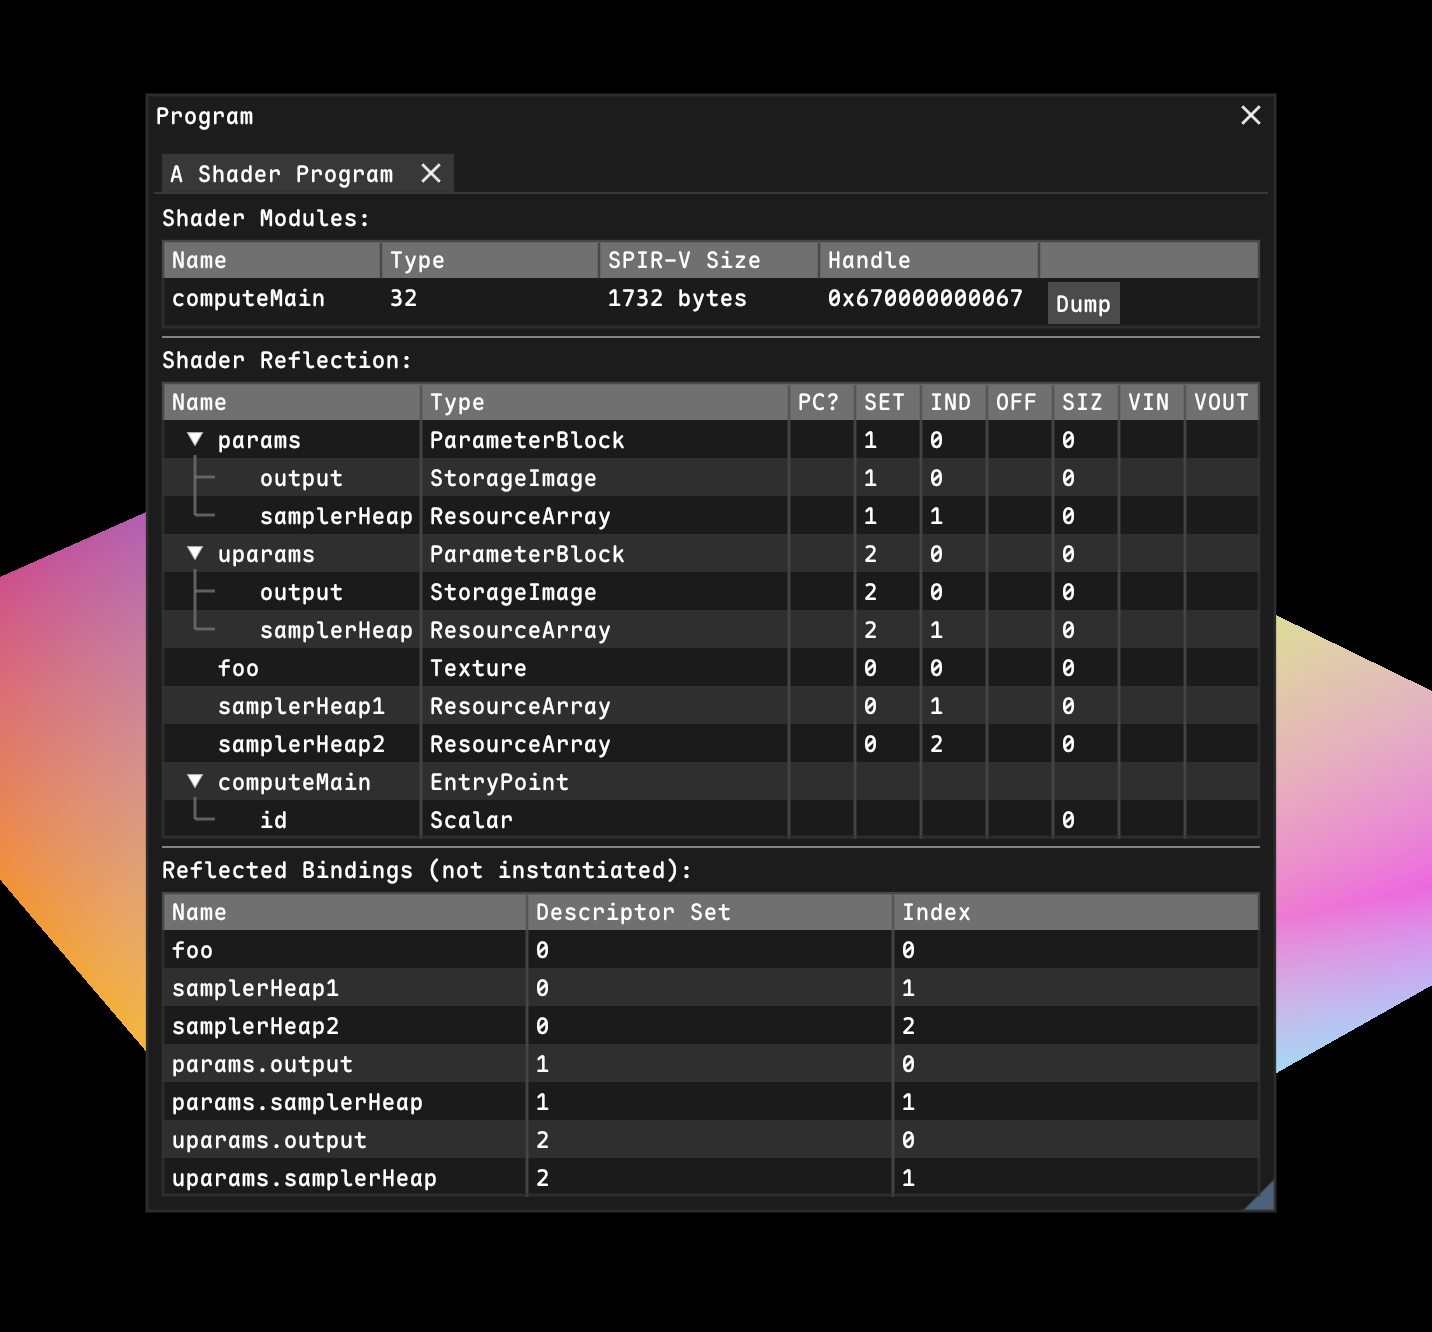
This is such a common thing that I've generally included a ::inspect() method on every class I build, as I'm interested in viewing the internal state of basically everything I'm working on in real-time.
Because that's the big thing you get with user interfaces: real-time feedback.
Printing something to the console is useful if you want a snapshot in time, but if you want to see how something changes over time, displaying a user interface with plots or tables is the obvious answer.
I've got a Render Graph class which schedules render passes on the Vulkan command queue, and I've got an ::inspect() method I call after running it to display the output of every resource (currently this just has a gbuffer task, but you get the point):
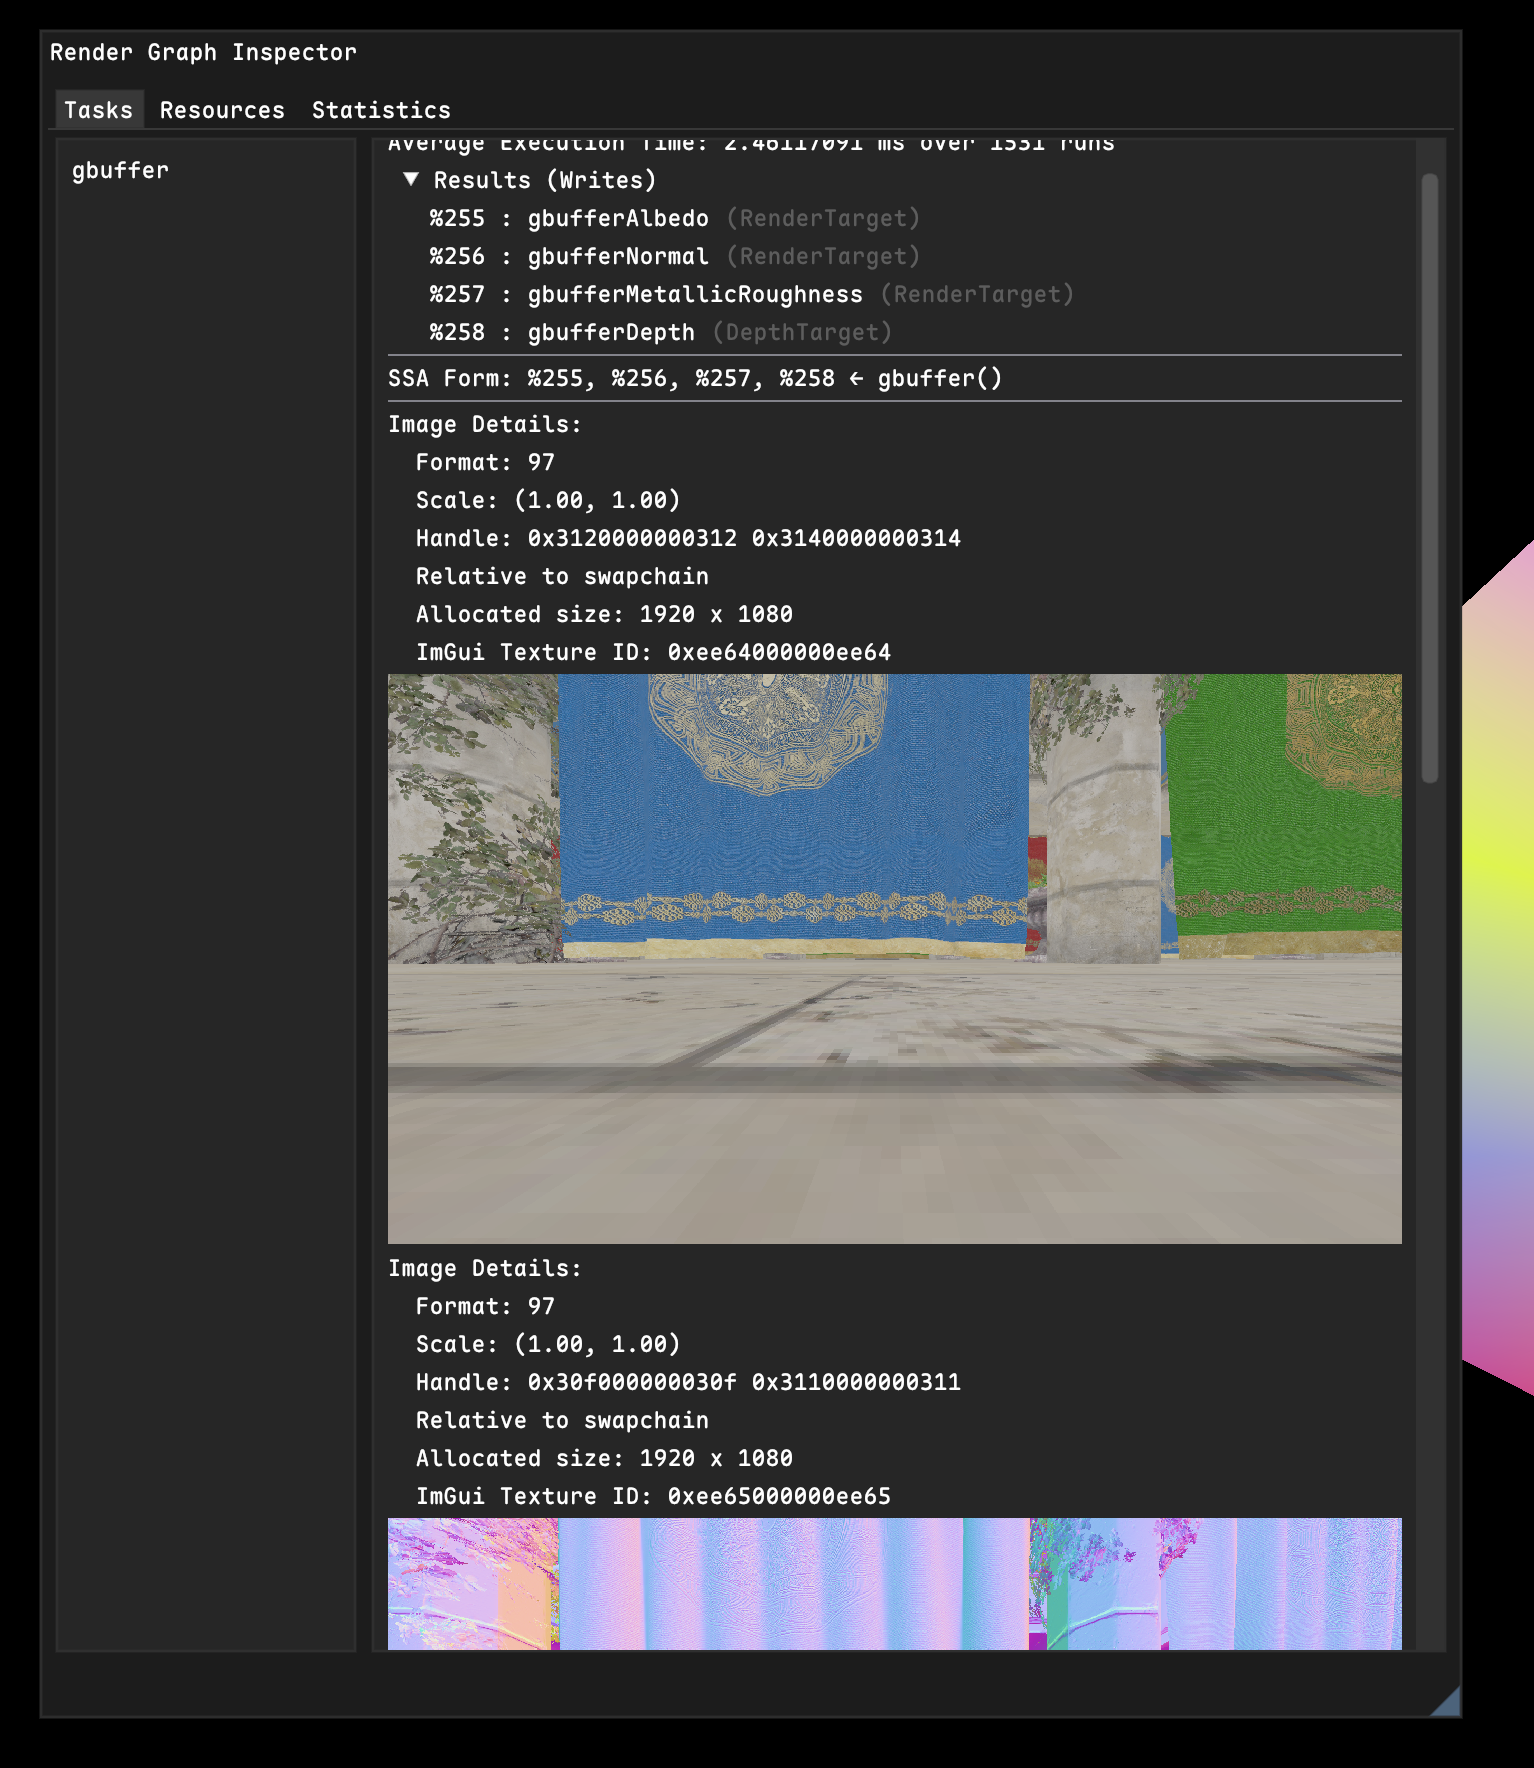
I call it inspect because that's what Unity calls it, and I think it's apt: you can inspect some data in your program, and even freely modify it with sliders and buttons and checkboxes.
This form of debugging has been more useful for me than printf debugging, but it has one problem.
In order to debug something, you need to run that code each frame, which means you somehow have to wire in to the central rendering loop somewhere, which has resulted in me just throwing a bunch of debugging logic into the Application class, which should not have all of this in it.
So I needed to find a way to capture this printf-style one-off debugging workflow, but without polluting the application with a bunch of ImGui calls.
The Idea
When building the console window, I realized something.
I've got all these LogMessage allocations in a list which are the result of a ren::println() or similar, and I have to render them each frame.
What if I could instead abstract the LogMessage structure (which contains log level, content, timestamp, etc) into an abstract LogItem class which has a virtual inspect() method?
Then, logging a message would make a LogItemMessage which implements inspection by simply displaying the text, but some other item could do something more fancy... Maybe it could call some lambda?
ref<ShaderProgram> program = ...
// This function is called once, much like println
ren::logUI("A Shader Program", [=]() {
    program->inspect(); // Just defer to the inspector.
});
This lets you capture all the state you need in the lambda capture, then display it with ImGui every frame when the log message is rendered in the console window. These "logged UIs" would then be inline with other log messages, which gives important context when debugging:
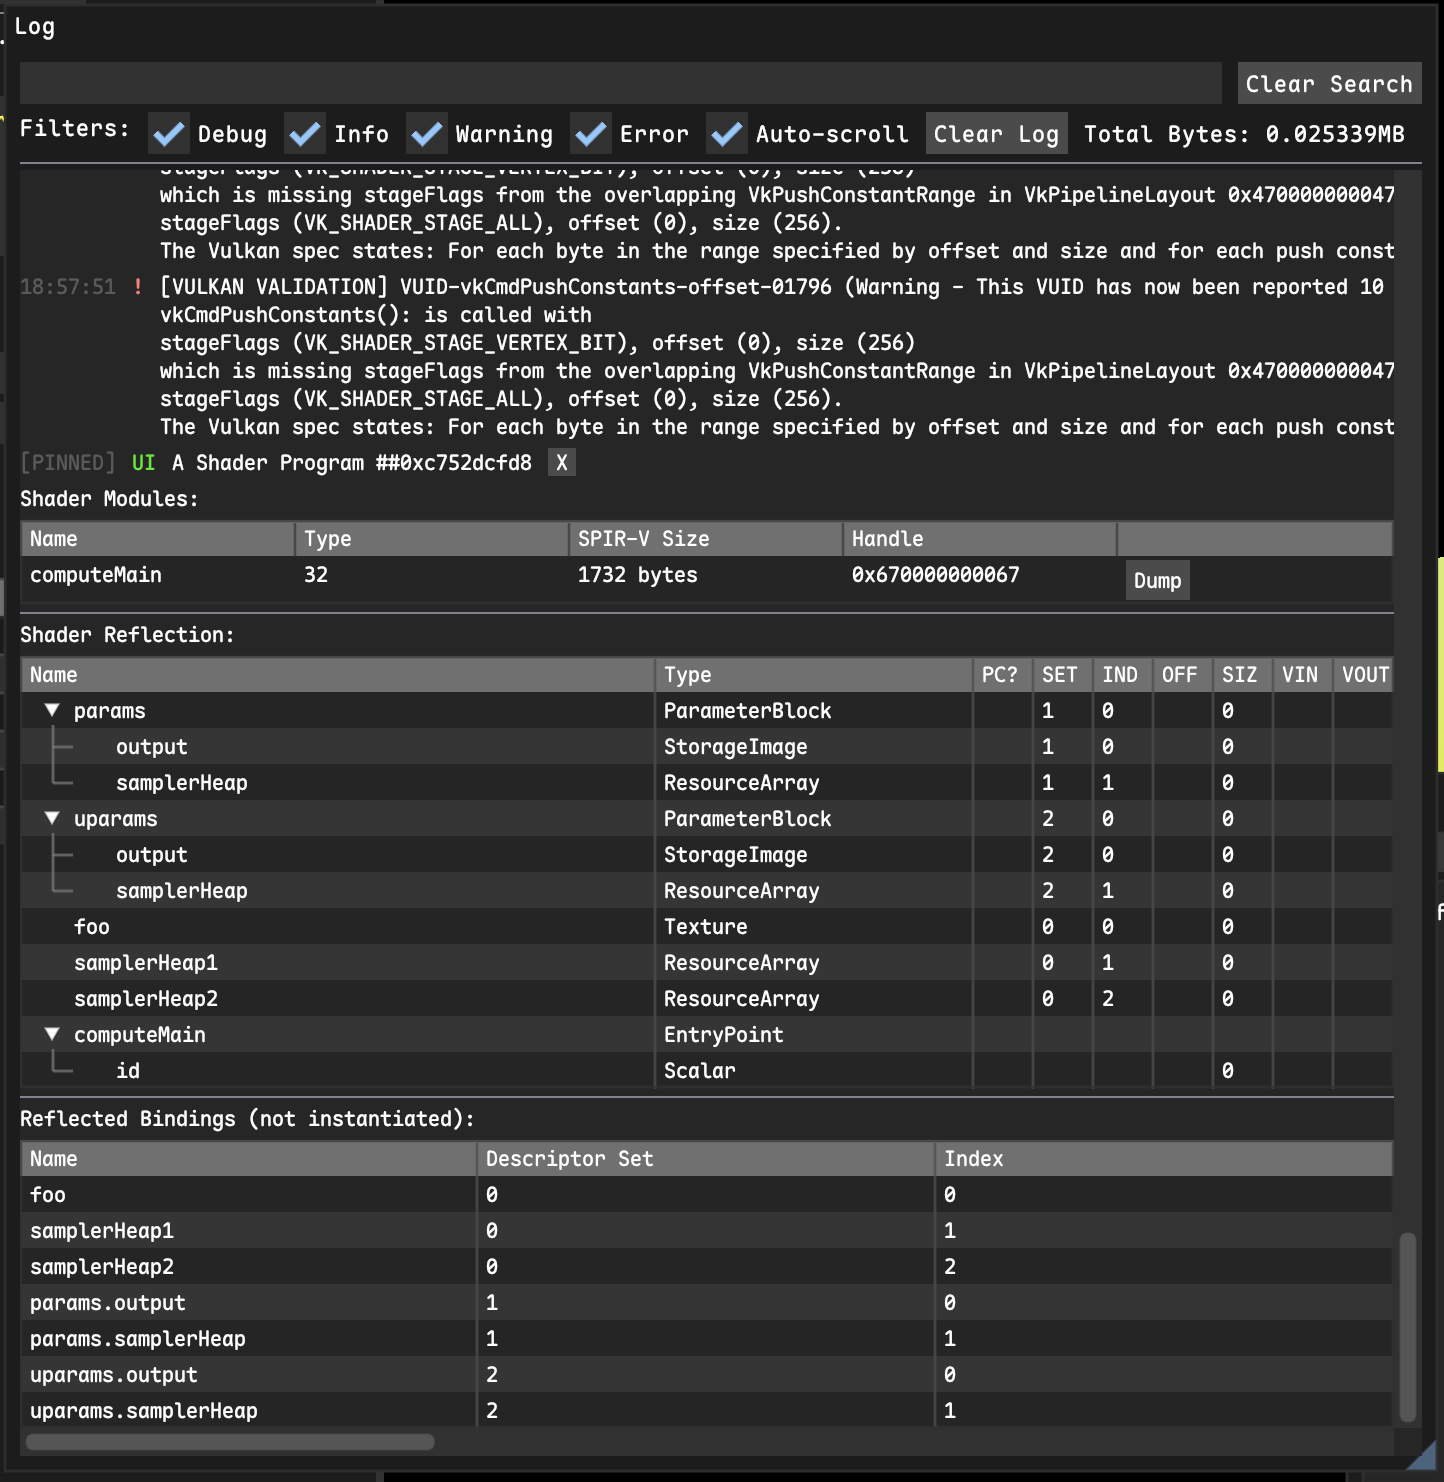
Here I "log the UI" of the shader after loading it from disk and compiling it, and I can clearly see that right before that, the Vulkan validation layer was complaining about how I compiled it.
Any other log messages are then displayed inline after the shader program's "logged UI".
Most of the time, I just want to call ::inspect() on some object, so I've also made a method logInspectable which just calls inspect for me:
ref<ShaderProgram> program = ...
ren::logInspectable("A Shader Program", program);
All of the state required to visualize some data just gets captured automatically by the lambda, and the timing of when to render UI is handled entirely by the console window, so logInspectable takes a std::shared_ptr / ref, which ensures that the object you are inspecting is alive for at least as long as the log message is.
I also include a little "x" button in the console which permanently closes the inspectable UI log, releasing all that state automatically, and the "clear log" button does the same thing.
Ever since building this, I've been turning to creating one-off user interfaces to display debug information instead of printing, which has been a totally new way to work, and honestly I think I might look into something like netImgui to generate the ImGui command list on a remote server in the lab and render it on my mac just to have this.
Interested if anyone else has played with or seen anything like this before.
Thanks for reading!